Operation Analytics and Investigating Metric Spike
- Oct 7, 2022
- 4 min read
Updated: Nov 11, 2022
Project Description:
Operation Analytics is the analysis done for the complete end-to-end operations of a company. With the help of this, the company then finds the areas in which it must improve upon. You work closely with the ops team, support team, marketing team, etc and help them derive insights from the data they collect.
Being one of the most important parts of a company, this kind of analysis is further used to predict the overall growth or decline of a company’s fortune. It means better automation, better understanding between cross-functional teams, and more effective workflows.
Investigating metric spikes is also an important part of operation analytics as a Data Analyst you must be able to understand or make other teams understand questions like- Why is there a dip in daily engagement? Why have sales taken a dip? Etc. Questions like these must be answered daily and for that, it's very important to investigate metric spikes.
You are working for a company like Microsoft and designated as Data Analyst Lead and are provided with different data sets, and tables from which you must derive certain insights it and answer the questions asked by different departments.
To measure the activeness of a user. Measuring if the user finds quality in a product/service. Calculate the weekly user engagement.
User growth: Amount of users growing over time for a product
Weekly Retention: Users getting retained weekly after signing up for a product
Weekly Engagement: To measure the activeness of a user. Measuring if the user finds quality in a product/service weekly.
Email Engagement: Users engage with the email service.
Approach:
All the questions asked can be answered through SQL. I used various operators and functions to get the solutions.
First, I created the new database and loaded all the files (SQL tables) present. Then, I performed an analysis of the Database to get the answers to all the questions asked.
Tech-Stack Used:
Microsoft SQL Server 2019 and Mode Studio
Dataset:
Insights:
All the questions asked can be answered through SQL. I used various operators and functions to get the solutions
1. Weekly User Engagement:
SELECT DATE_TRUNC('week', e.occurred_at),
COUNT(DISTINCT e.user_id) AS weekly_active_users
FROM tutorial.yammer_events e
WHERE e.event_type = 'engagement'
AND e.event_name = 'login'
GROUP BY 1
ORDER BY 1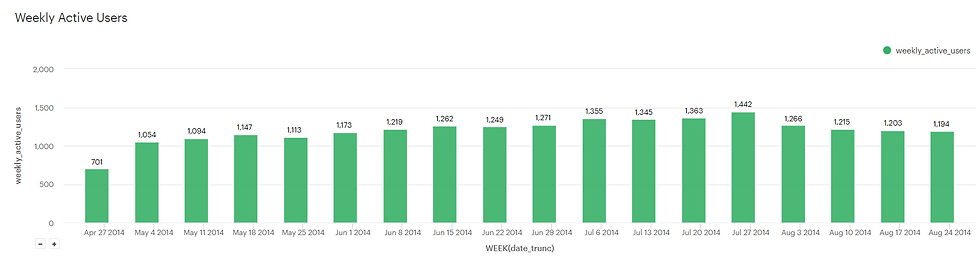
Here, we can see that the number of active users started decreasing after July 2014.
2. User Growth:
SELECT DATE_TRUNC('day',created_at) AS day,
       COUNT(*) AS all_users,
       COUNT(CASE WHEN activated_at IS NOT NULL THEN u.user_id ELSE NULL END) AS activated_users
  FROM tutorial.yammer_users u
 WHERE created_at >= '2014-06-01'
   AND created_at < '2014-09-01'
 GROUP BY 1
 ORDER BY 1
Here, we can notice that nothing has really changed about the growth rate but it continues to be high during the week, and low on weekends; might be because people are on family time, self-care and/or travelling.
3. Weekly Retention:
SELECT DATE_TRUNC('week',z.occurred_at) AS "week",
       AVG(z.age_at_event) AS "Average age during week",
       COUNT(DISTINCT CASE WHEN z.user_age > 70 THEN z.user_id ELSE NULL END) AS "10+ weeks",
       COUNT(DISTINCT CASE WHEN z.user_age < 70 AND z.user_age >= 63 THEN z.user_id ELSE NULL END) AS "9 weeks",
       COUNT(DISTINCT CASE WHEN z.user_age < 63 AND z.user_age >= 56 THEN z.user_id ELSE NULL END) AS "8 weeks",
       COUNT(DISTINCT CASE WHEN z.user_age < 56 AND z.user_age >= 49 THEN z.user_id ELSE NULL END) AS "7 weeks",
       COUNT(DISTINCT CASE WHEN z.user_age < 49 AND z.user_age >= 42 THEN z.user_id ELSE NULL END) AS "6 weeks",
       COUNT(DISTINCT CASE WHEN z.user_age < 42 AND z.user_age >= 35 THEN z.user_id ELSE NULL END) AS "5 weeks",
       COUNT(DISTINCT CASE WHEN z.user_age < 35 AND z.user_age >= 28 THEN z.user_id ELSE NULL END) AS "4 weeks",
       COUNT(DISTINCT CASE WHEN z.user_age < 28 AND z.user_age >= 21 THEN z.user_id ELSE NULL END) AS "3 weeks",
       COUNT(DISTINCT CASE WHEN z.user_age < 21 AND z.user_age >= 14 THEN z.user_id ELSE NULL END) AS "2 weeks",
       COUNT(DISTINCT CASE WHEN z.user_age < 14 AND z.user_age >= 7 THEN z.user_id ELSE NULL END) AS "1 week",
       COUNT(DISTINCT CASE WHEN z.user_age < 7 THEN z.user_id ELSE NULL END) AS "Less than a week"
  FROM (
        SELECT e.occurred_at,
               u.user_id,
               DATE_TRUNC('week',u.activated_at) AS activation_week,
               EXTRACT('day' FROM e.occurred_at - u.activated_at) AS age_at_event,
               EXTRACT('day' FROM '2014-09-01'::TIMESTAMP - u.activated_at) AS user_age
          FROM tutorial.yammer_users u
          JOIN tutorial.yammer_events e
            ON e.user_id = u.user_id
           AND e.event_type = 'engagement'
           AND e.event_name = 'login'
           AND e.occurred_at >= '2014-05-01'
           AND e.occurred_at < '2014-09-01'
         WHERE u.activated_at IS NOT NULL
       ) z

 GROUP BY 1
 ORDER BY 1
LIMIT 100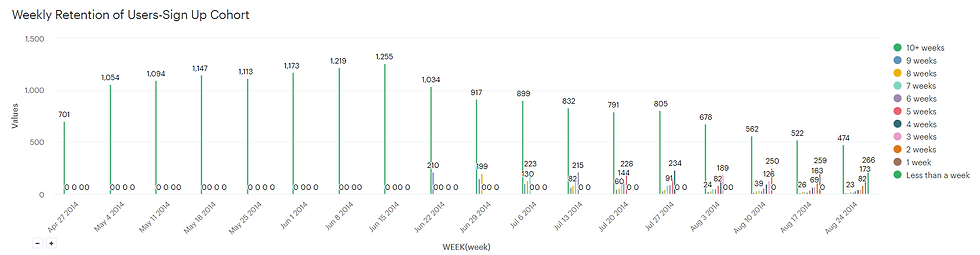
This graph shows when the cohort users signed up for the product. This shows a decrease in engagement among users who signed up more than 10 weeks ago.
4. Weekly Engagement:
SELECT DATE_TRUNC('week', occurred_at) AS week,
       COUNT(DISTINCT e.user_id) AS weekly_active_users,
       COUNT(DISTINCT CASE WHEN e.device IN ('macbook pro','lenovo thinkpad','macbook air','dell inspiron notebook',
          'asus chromebook','dell inspiron desktop','acer aspire notebook','hp pavilion desktop','acer aspire desktop','mac mini')
          THEN e.user_id ELSE NULL END) AS computer,
       COUNT(DISTINCT CASE WHEN e.device IN ('iphone 5','samsung galaxy s4','nexus 5','iphone 5s','iphone 4s','nokia lumia 635',
       'htc one','samsung galaxy note','amazon fire phone') THEN e.user_id ELSE NULL END) AS phone,
        COUNT(DISTINCT CASE WHEN e.device IN ('ipad air','nexus 7','ipad mini','nexus 10','kindle fire','windows surface',
        'samsumg galaxy tablet') THEN e.user_id ELSE NULL END) AS tablet
  FROM tutorial.yammer_events e
 WHERE e.event_type = 'engagement'
   AND e.event_name = 'login'
 GROUP BY 1
 ORDER BY 1
LIMIT 100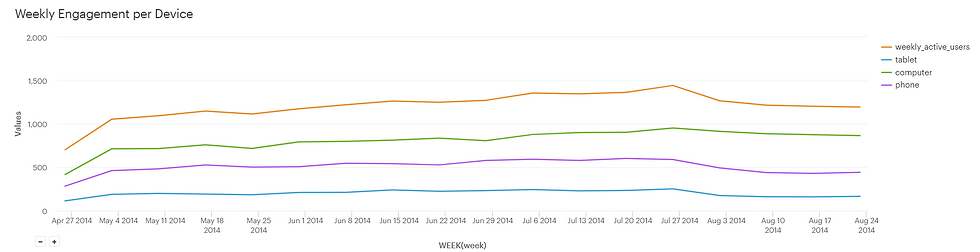
This graph shows various device types used by the cohort users, and there is a very steep drop in phone users' engagement rates after July.
5. Email Engagement:
SELECT DATE_TRUNC('week', occurred_at) AS week,
       COUNT(CASE WHEN e.action = 'sent_weekly_digest' THEN e.user_id ELSE NULL END) AS weekly_emails,
       COUNT(CASE WHEN e.action = 'sent_reengagement_email' THEN e.user_id ELSE NULL END) AS reengagement_emails,
       COUNT(CASE WHEN e.action = 'email_open' THEN e.user_id ELSE NULL END) AS email_opens,
       COUNT(CASE WHEN e.action = 'email_clickthrough' THEN e.user_id ELSE NULL END) AS email_clickthroughs
  FROM tutorial.yammer_emails e
 GROUP BY 1
 ORDER BY 1
Here, we can clearly observe that the clickthroughs dropped post-July and because of that engagement decreased.
Result:
After doing all the analyses, it appears that the issue is with mobile users' use and email clickthroughs.
The action here should be clear: the problem is concentrated in these areas and the respective team should check that something isn't broken or implemented incorrectly. Also, it is not completely clear from the data what the problem is or how it should be solved. But the marketing or operations, and other teams can get sufficient insights from this.


Comments